We develop equipment and software together. That way, how we measure is tied to how we analyze from the start, and what a project teaches becomes a working tool for your team.
Equipment as a service
hardware + application
Setup, installation, training and support defined according to the project.
Software by subscription
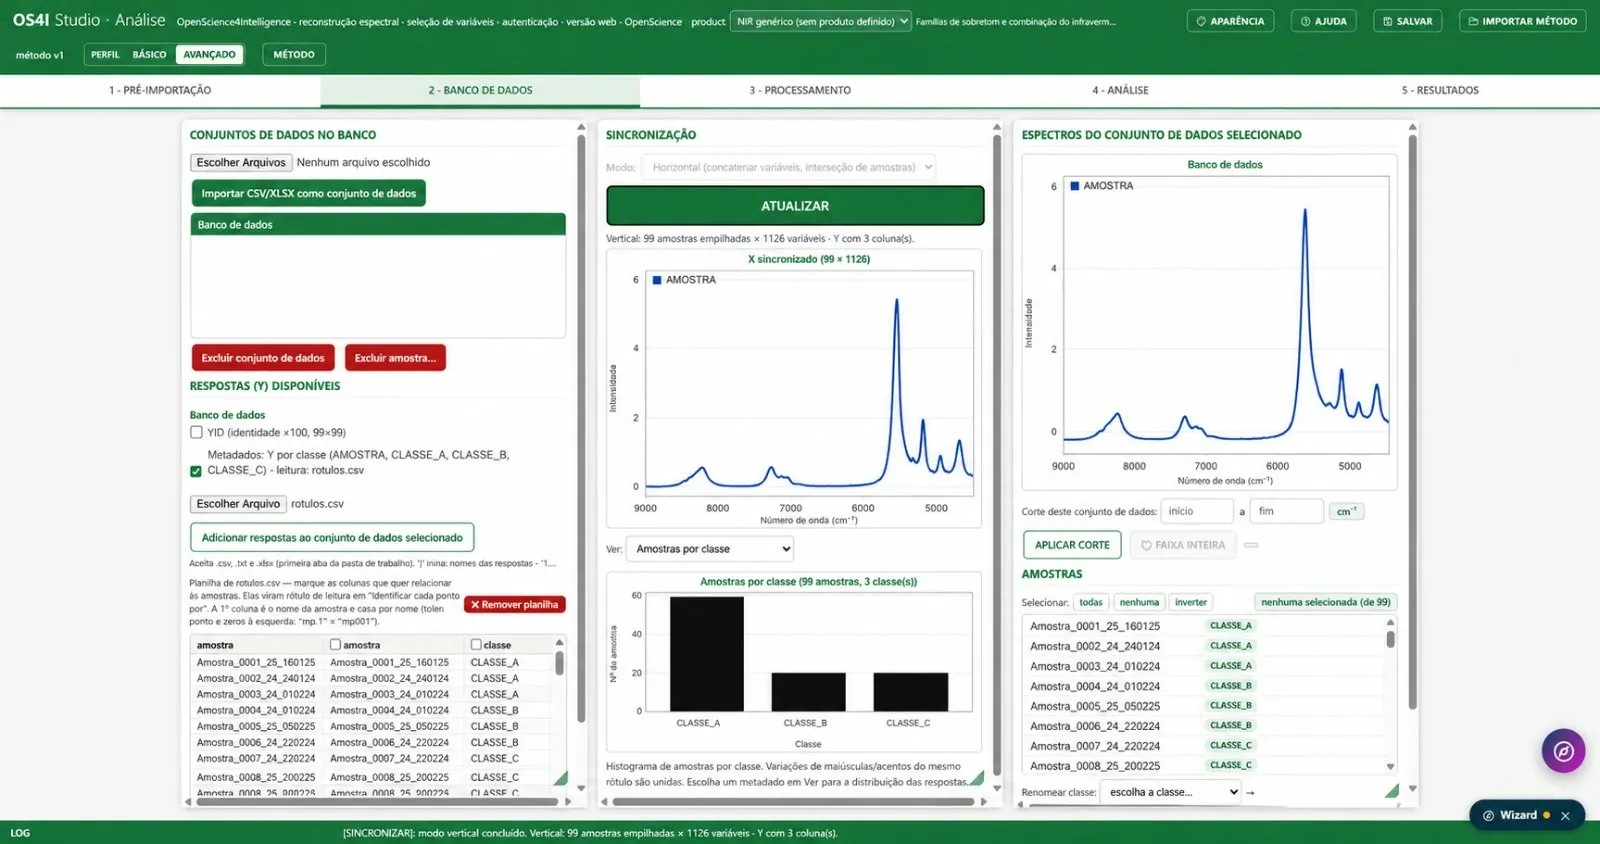
analysis tools
Access to the platforms, with updates and support according to the plan.
Teaching and research
academic license
Conditions for universities and research groups.
Dedicated project
custom development
Scope, deliverables and technology transfer agreed from the start.
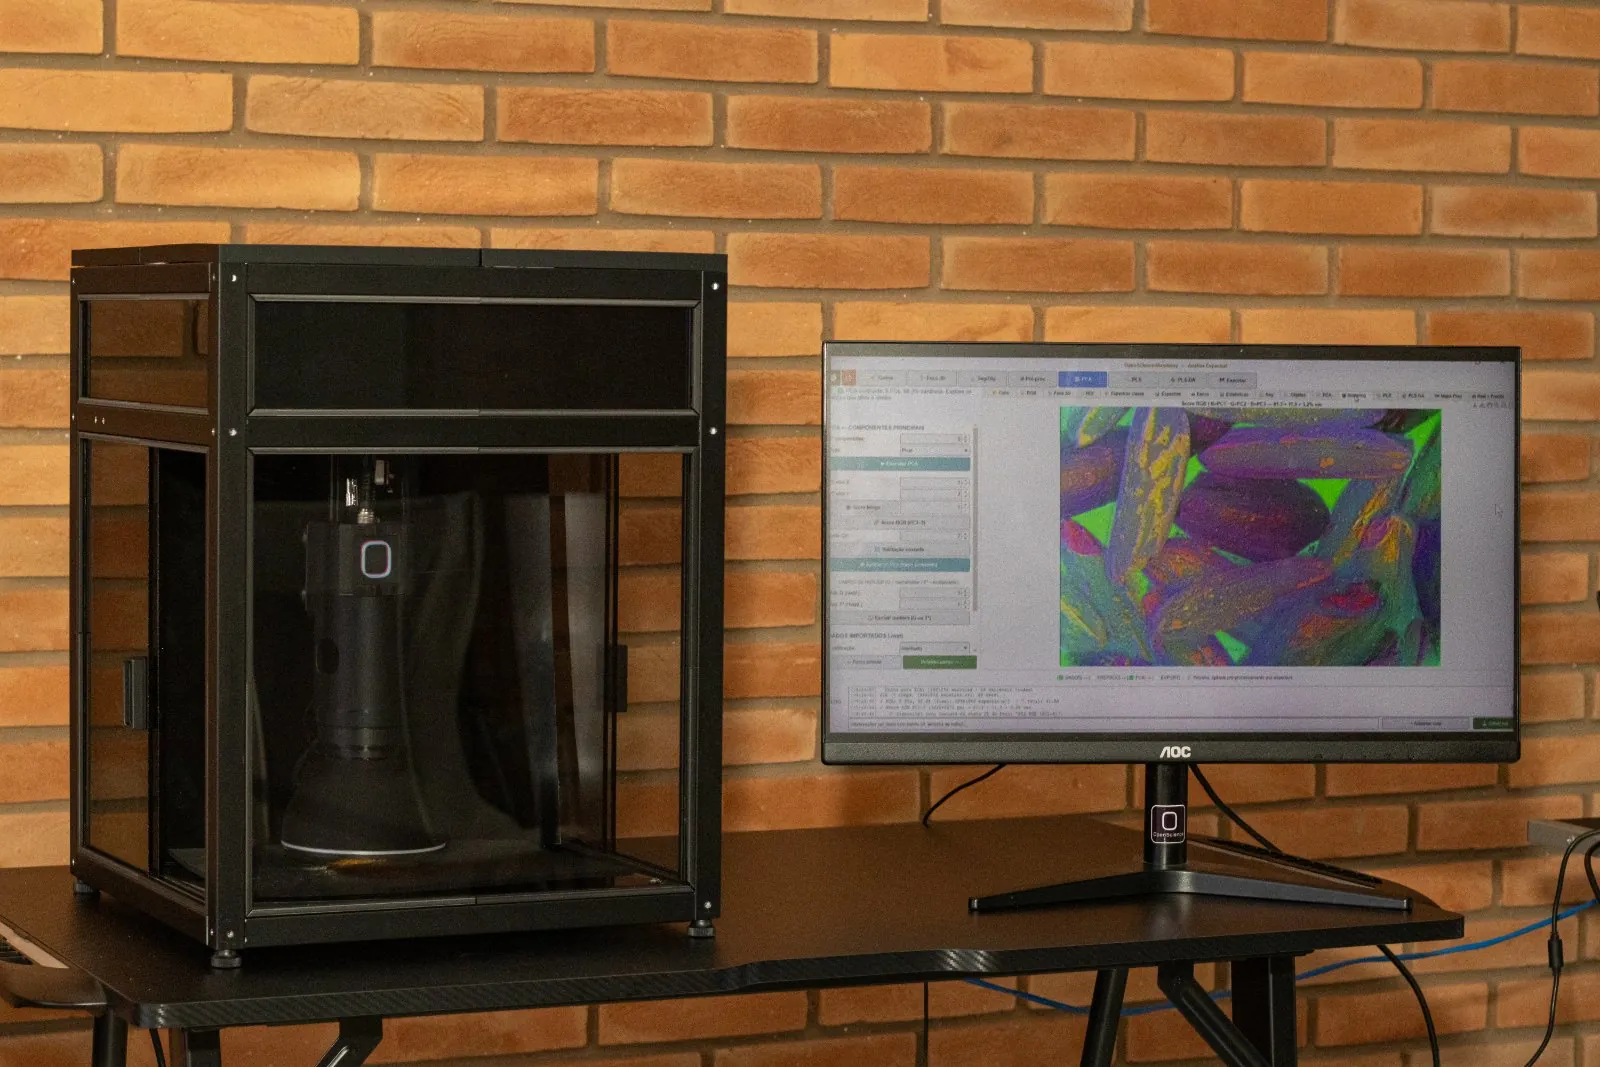
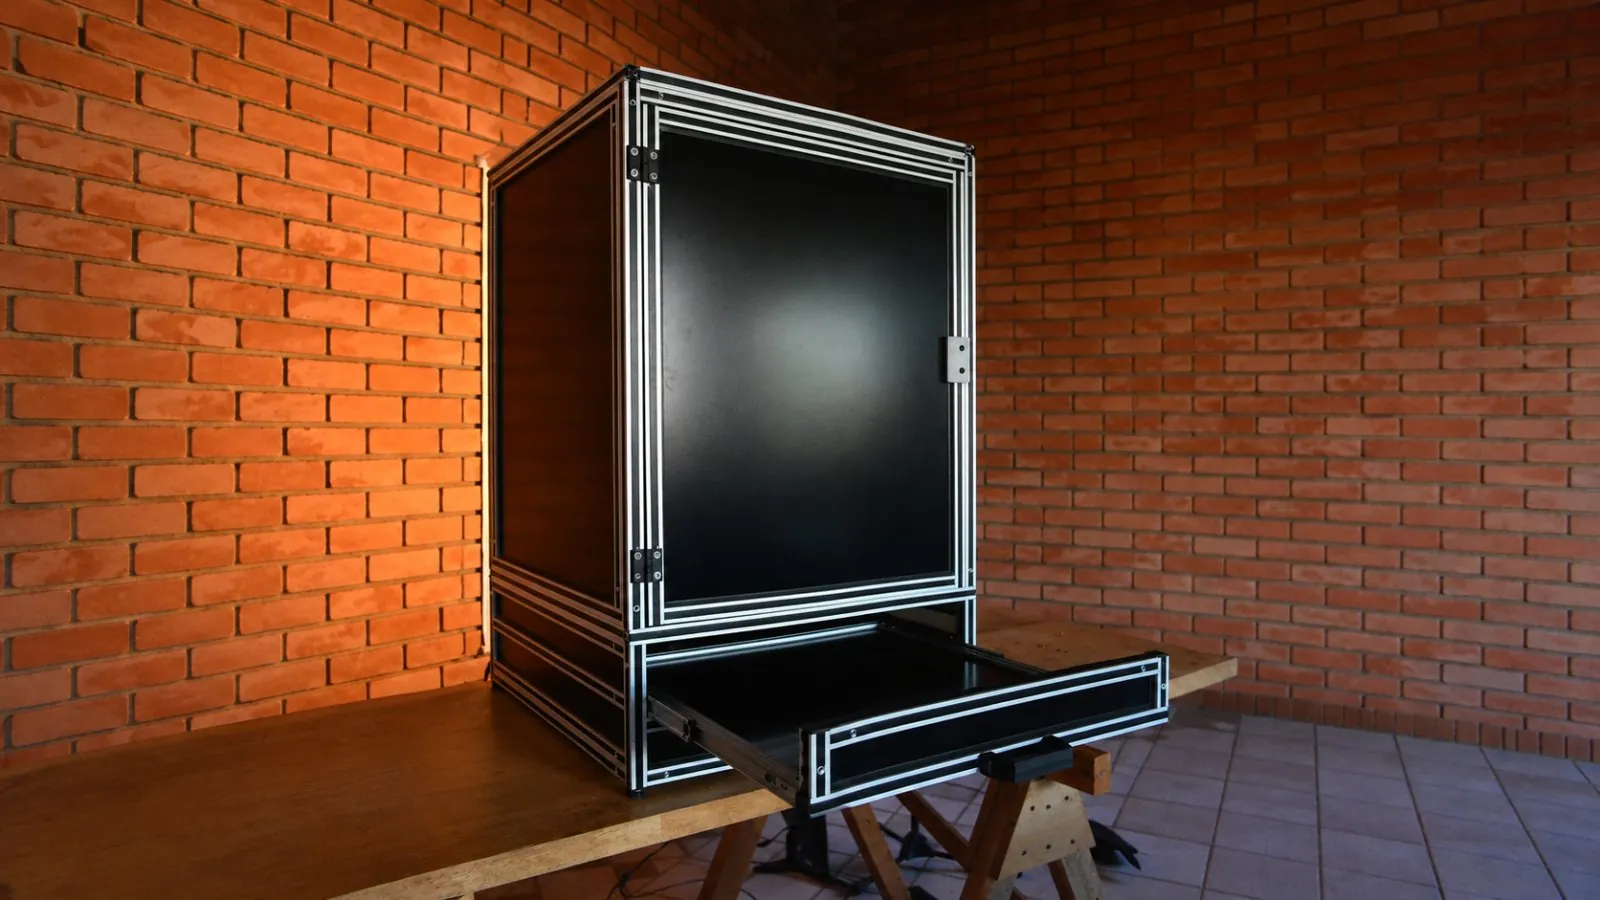
Multispectral system for larger samples: grains, seeds and vegetables. Up to 35 wavelengths between 365 and 1100 nm, under 60 s per sample, 40 × 40 cm usable area.
Dedicated projectMade to order
Custom equipment
We design spectral vision systems for classification and process control.
VIS, NIR and SWIR cameras
Dedicated illumination and enclosed cabinets
Integration with the production line
HaaS + SaaSIn operation
Imajan HS4017, coffee classifier
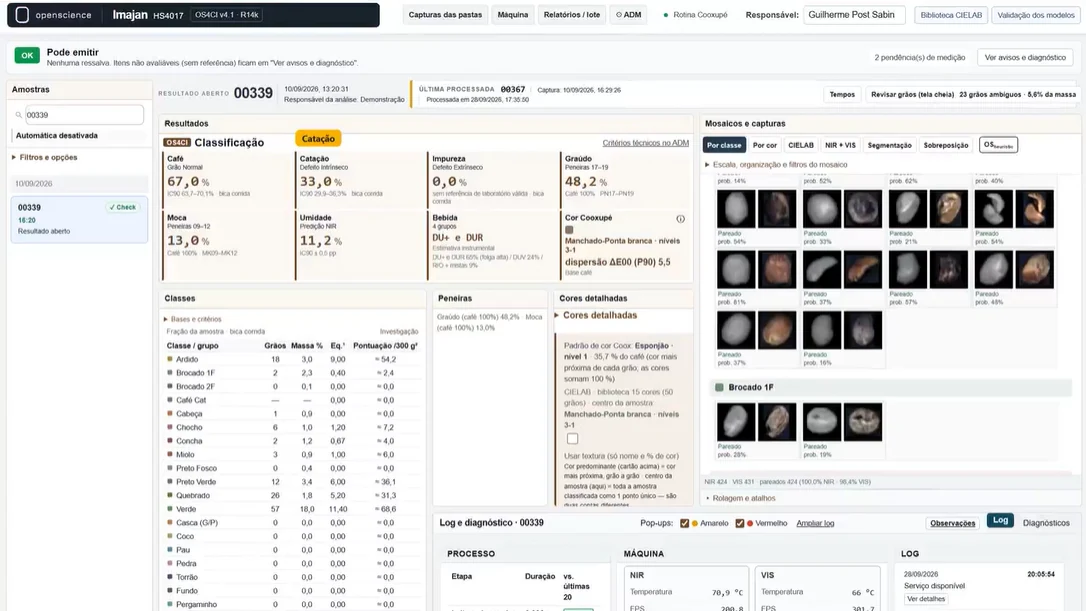
Two hyperspectral cameras (VIS and NIR), a conveyor with an automatic separator and a barcode reader. Each bean is segmented and classified, and OS4CI analyzes each sample automatically, in about 30 s.
Interface of the Imajan HS4017 for coffee classification: composition by the Brazilian Official Classification, sieves and moka, review of ambiguous beans, CIELAB color, camera status and a report per sample, with traceability of every result.
SaaSIn operation
OS4I Studio · Authentication and fraud
Spectral analysis for authentication and fraud detection: measures how far a sample departs from what is genuine, with leakage-free validation.
PCA, DD-SIMCA, OPLS-DA, PLS-DA and variable selection
SaaSIn operation
OS4DC · Deconvolution
Deconvolution, alignment and identification of compounds in GC-MS. Chromatogram, components per window, recovered spectrum, extracted ion, PCA and identification report, all open in the same interface.
SIMPLISMA + MCR-ALS with constraints
Identification by similarity against reference libraries
Guided tour and mixture deformulation
Perfumery: composition assessed compound by compound, with an identification report
Academic licenseIn operation
OS4A · Image chemometrics
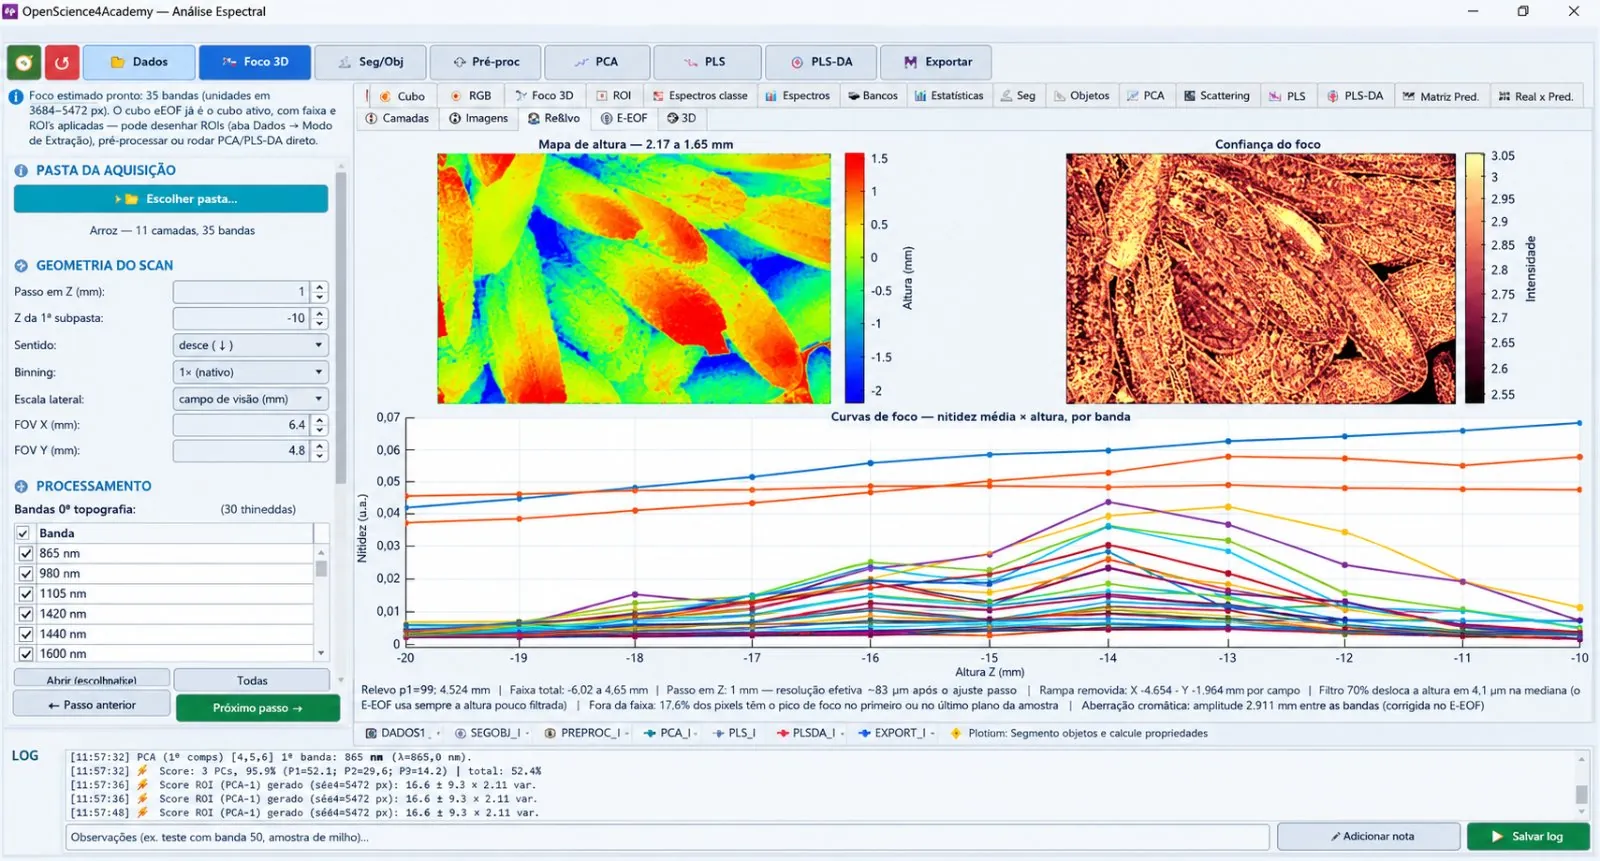
Chemometrics and multispectral imaging for research and teaching: data, 3D focus, object segmentation, preprocessing, PCA, PLS, PLS-DA and export, in the same interface. In the image, the 3D Focus tab comparing rice with extended focus and with a single plane.
Multispectral and hyperspectral cubes
Cross-validation grouped by region
Distributed as a licensed executable
↔Single planeExtended focus
With the microscopeIn operation
Multispectral extended focus
Z sweep and a fully focused image in every band, ready for chemometrics. The height map and 3D reconstruction are in the next card.
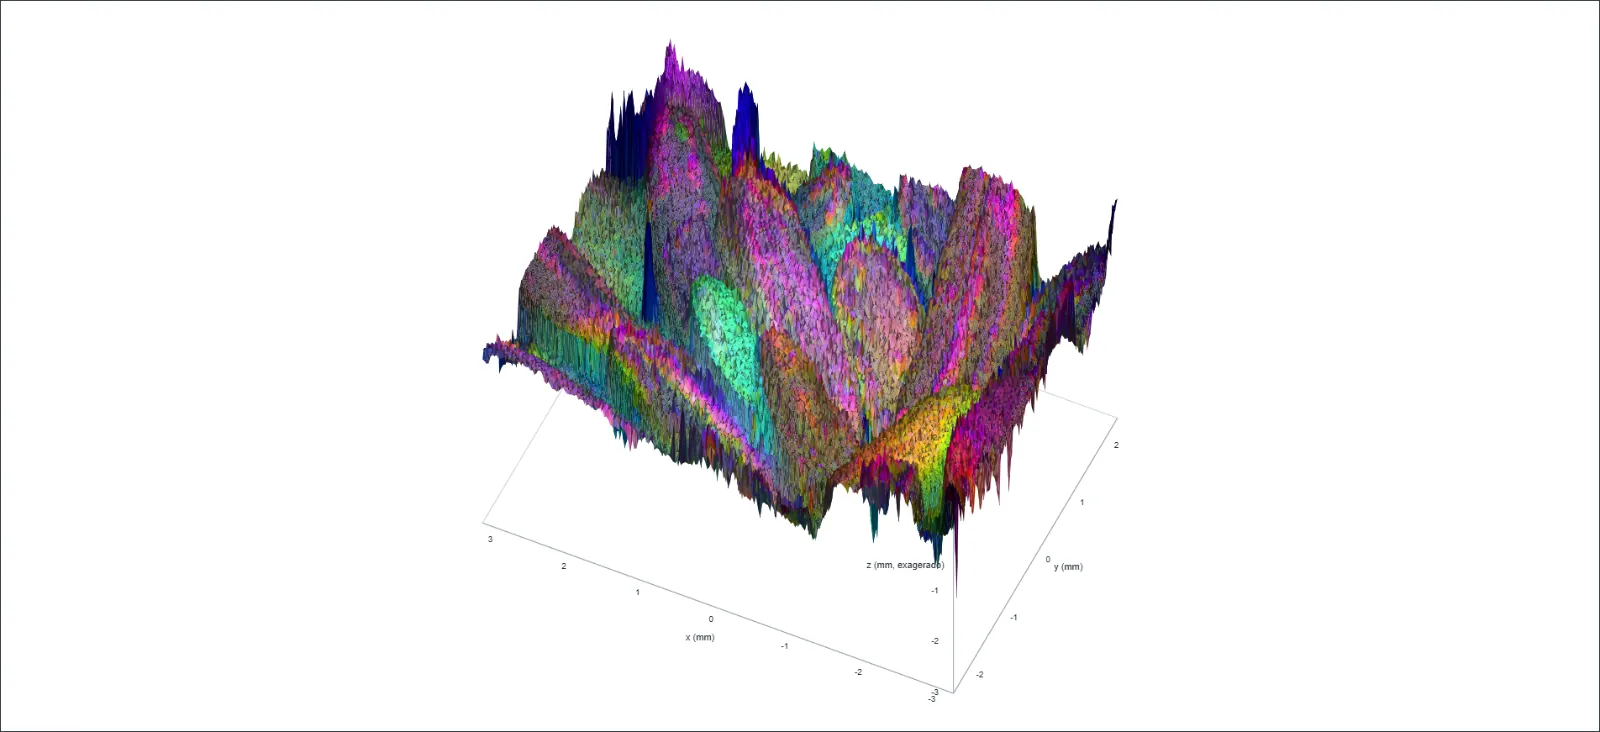
Height map and 3D chemical image from a Z sweep, with focus corrected in every band, in the 3D Focus tab of OS4A. Validated on a real rice cube, with 11 Z planes and 35 bands from 365 to 1600 nm. In the image, the same surface in visible color and colored by chemistry.
TrainingIn operation
GC-MS simulators
More than nine interactive simulators of the instrument and software, and a generator of runs with coelution for practice. With handbooks and tailored courses.
GC-MS simulator for teaching
In-company and university courses
A federal university team trained in deconvolution, alignment and compound identification