OpenScienceOpenScience
PROPOSE A CHALLENGE PT

Multispectral Microscope

Built for researchers, engineers and professionals who need high spectral resolution with automation.

REQUEST A DEMO

Equipment highlights

Beyond the conventional microscope

Captures one image per wavelength, from ultraviolet to near-infrared, in a single instrument.

Configurable

Choose the standard model or only the spectral ranges your application needs. Later upgrades are possible.

Three-axis automation

Integrated with a high-precision CNC system, it handles spectral mapping by area and focus by depth.

SPECIFICATIONS

Technical sheet

Spectral range365 to 1600 nm
Wavelengthsup to 32, configurable
IlluminationNarrow-band sequential LEDs
Automation3 axes (X, Y, Z) via CNC
SoftwareAcquisition, segmentation, spectral analysis, modeling, cube export
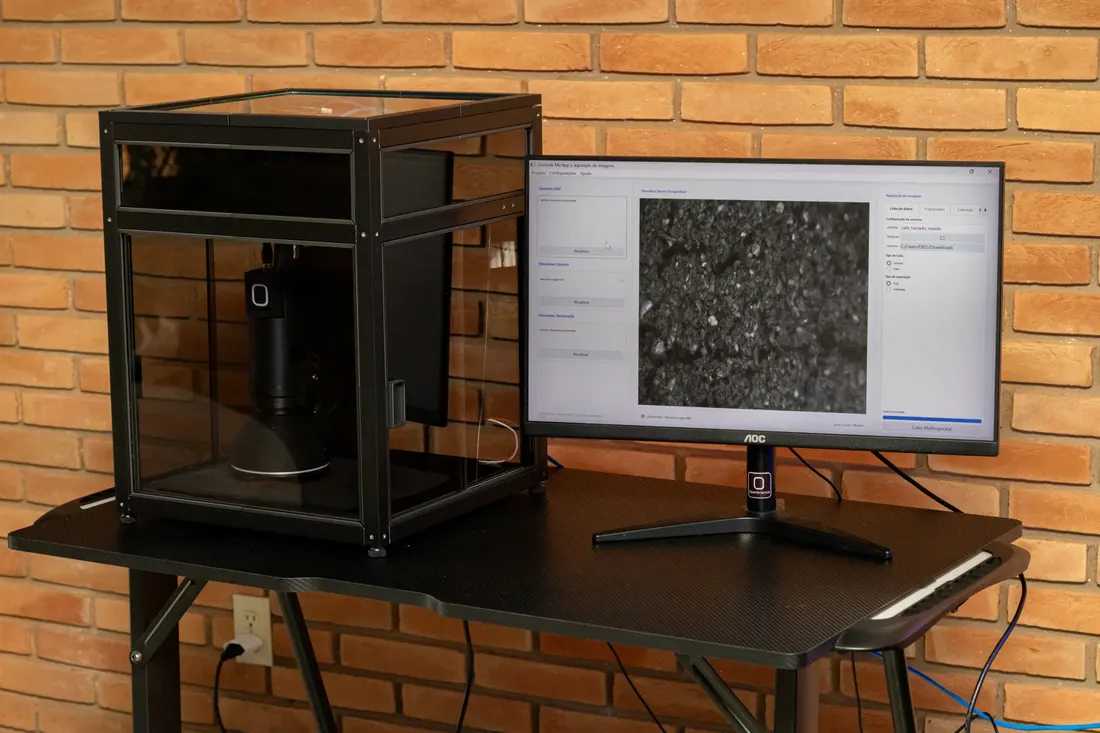
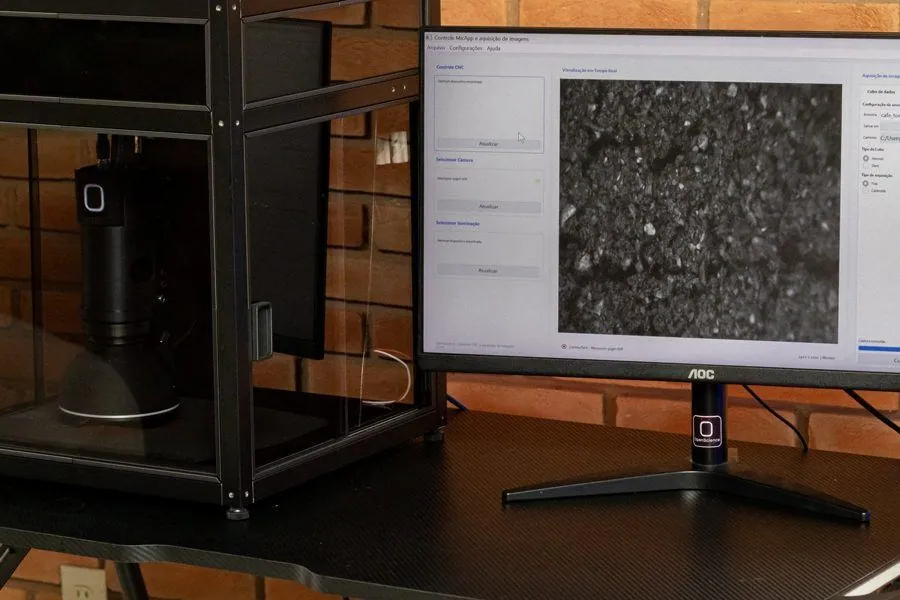
Automated multispectral microscope on the bench, with the monitor showing the sample image
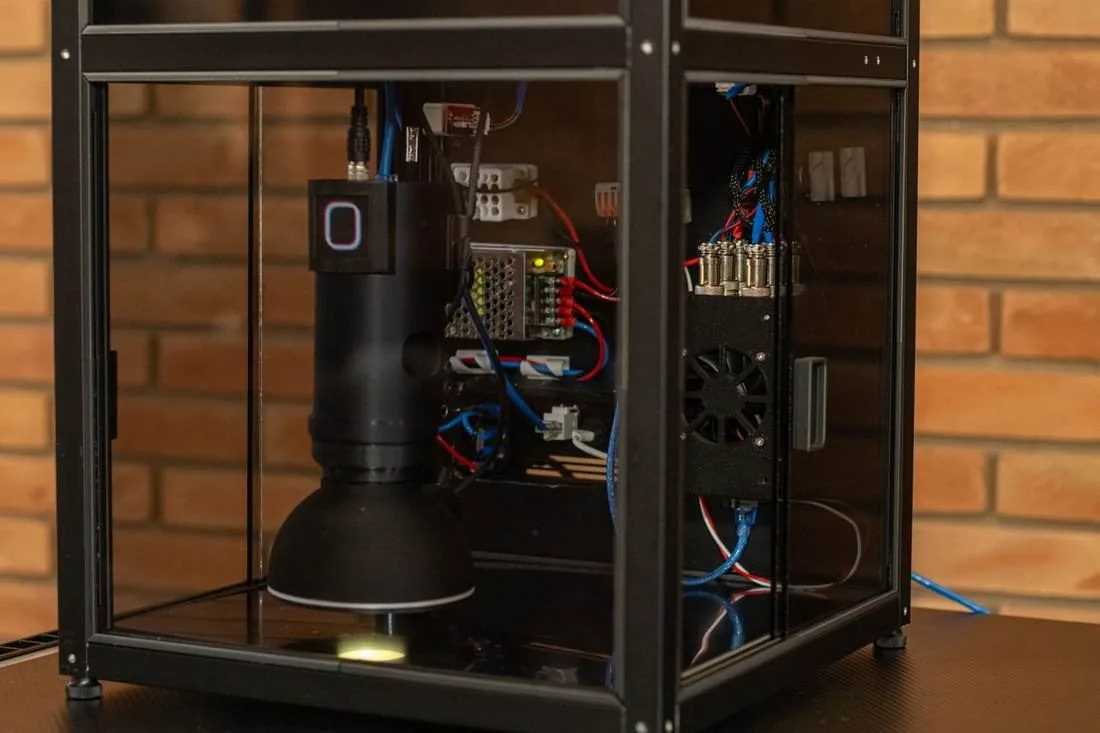
Cabinet interior: optical column, LED illumination and control electronics
BUILD

Enclosed cabinet, integrated electronics

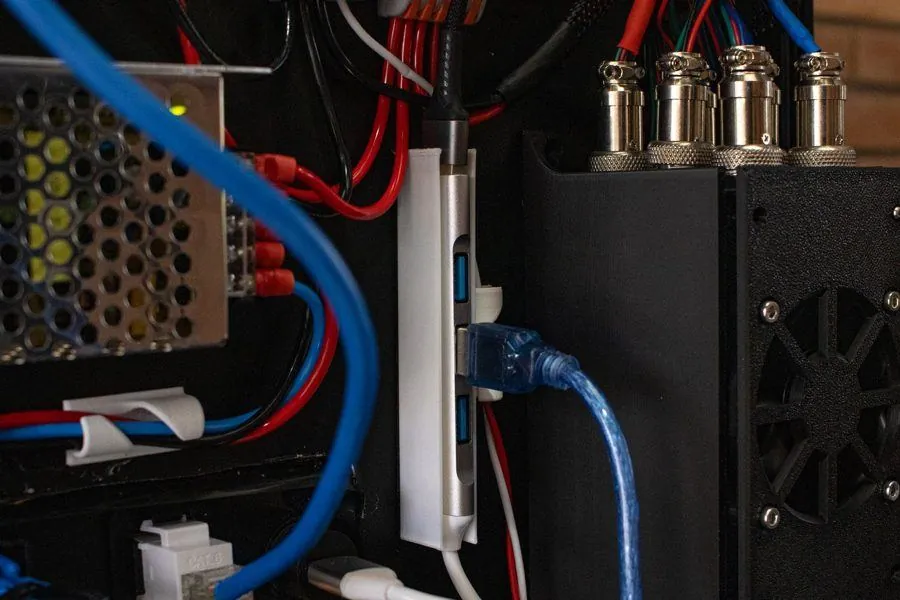
Aluminum-profile structure with smoked glass that isolates the sample from ambient light. Optical column, power supply, LED controller and ventilation sit inside the cabinet, with external connectors for camera, lighting and automation.

HOW IT WORKS

From sample to result in four steps

Three-axis automation platform of the multispectral microscope
  1. Step 1

    Position

    The sample is positioned and autofocus finds the ideal plane.

  2. Step 2

    Capture

    The LEDs light up in sequence and the camera records one image per band.

  3. Step 3

    Map

    The system scans the area in X and Y and assembles the full spectral cube.

  4. Step 4

    Analyze

    Segmentation, intensity maps and export to your own models.

Image in a single plane at 700 nm, partly out of focus Same scene at 700 nm with extended focus, sharp across the whole area Single plane · 700 nmExtended focus · 700 nm

A spectrum in every pixel, and every pixel in focus.

A spectrometer measures the average of the sample. OpenScience’s multispectral microscope measures the chemical response of every point, from ultraviolet to near-infrared, and shows where each difference is.

The problem

Each wavelength focuses at a different height

In a single plane, part of the sample is out of focus and each pixel mixes the signal of its neighbors. The resulting spectrum is not the sample’s.

The solution

Acquisition at several depths

Controlled illumination and a Z sweep. For each pixel, the spectrum is built only from the bands in focus.

The result

Real spectrum and topography in the same image

Hardware and software developed by OpenScience, with integrated chemometrics to classify and quantify.

Multispectral microscope with the optical head over the grains
Optical head over the sample, inside the cabinet
Illumination ring lit over grains
Each wavelength, a reading of the sample
Grains under colored illumination
Grains under multispectral illumination
Equipment interior with the optical head and electronics
Optics and electronics built to order
Control electronics and cables of the equipment
Control and drive electronics
Equipment and monitor showing the sample image in the software
Equipment and software

Where it makes a difference

FloursAdulteration, cereal blends, contaminants and homogeneity.
GrainsDefects, fungi, contaminants and classification by origin.
Roasted and ground coffeeIdentification of irregularities and adulterants in small sample areas.
FeedsComposition, undeclared ingredients and blend uniformity.
Pharmaceuticals and polymersDistribution of active and excipients, component maps, counterfeiting and process deviations.
Materials and surfacesSpectral mapping by area with automatic depth focus.
Biological samplesTissues, seeds and plant materials, with a chemical map by region.
Teaching and researchOpen platform for developing chemometric methods at universities.

Want to see the equipment with your own samples?

We can schedule a remote or in-person demo in Campinas, Brazil.

REQUEST A DEMO